
Every business wants to keep its people safe — it’s the foundation of a healthy, productive workplace. But when safety data is scattered across spreadsheets, paper forms, or emails, it can be hard to spot the bigger picture. You miss the patterns that matter, and opportunities to make meaningful improvements slip through the cracks.
That’s where standardised safety metrics come in. By capturing, measuring, and sharing safety data in a consistent way, teams can understand what’s really happening, where to focus their efforts, and how to build a stronger safety culture. In this article, we’ll explore why this approach is so powerful and how it can help your business create a safer, more resilient environment for everyone.
The Challenge of Wrong or Inconsistent Data
Keeping staff healthy and safe is the lifeblood of all organisations. And you can’t do this if you’re not collecting the right data. Or if your data is presented in an inconsistent manner.
We often see that organisations collect data from a number of different sources, such as paper forms, emails, digital reporting systems, or a mixture of all of these. This disparate way of reporting incidents and near misses makes it more difficult to spot trends across departments and sites.

What are Standardised Safety Metrics?
Standardised safety metrics are clearly defined, universally applied measures that organisations use to track, assess, and compare their safety performance.
These metrics ensure that incidents, near-misses, observations, audits, and corrective actions are recorded and analysed in the same way across departments, sites, and teams.
Below are some examples of standardised safety metrics you could use to measure your safety performance:
- Accident Frequency Rate (AFR) - how often RIDDOR-reportable incidents occur per 100,000 hours worked
- Lost Time Injury Frequency Rate (LTIFR) - tracks lost time injuries per 100,000 hours worked
- Lost Time Injury Severity Rate (LTISR) - average number of days lost per lost time injury
- Total Recordable Injury Frequency Rate (TRIFR) - includes all recordable incidents per 100,000 hours worked
- Near Miss Frequency Rate (NMFR) - frequency of near misses per 100,000 hours worked
Having these consistent figures will help you benchmark what good looks like within your organisation and spot outliers in the data.
Why are Standardised Safety Metrics Important?
Standardised safety metrics are important for spotting and preventing incidents from occurring. Accurately and consistently tracking the same data will help you to identify behaviour that deviates from the norm and could indicate systematic safety risks at a site or departmental level.
They can also foster a stronger safety culture built on shared understanding and accountability across teams. By aligning safety efforts across departments, organisations can operate more efficiently, ensuring that everyone works toward the same objectives and best practices. At the same time, standardised metrics enable data‑backed decision making, allowing leaders to prioritise resources and interventions based on clear evidence and trends.
By relying on common definitions and consistent data capture, standardised metrics enable organisations to:
- Identify trends and root causes more accurately
- Benchmark performance across departments or locations
- Make data-driven decisions
- Foster a strong, company‑wide culture of safety.
Standardised safety metrics ensure accurate safety reporting, allowing you to benchmark performance and comply with HSE regulations.
How Can Vatix Help?
Within the Vatix platform, we have built a standardised safety metrics dashboard which calculates all the key metrics listed above.
On the Safety Metrics page within the Object Manager, you can easily add and manage a section for tracking total hours worked per month. This ensures all event records include standardised safety metric fields, making your reporting process consistent and reliable.
When an incident is logged, users are prompted with the question: “Is this a recordable incident?” – guaranteeing that critical data is captured at the point of entry rather than being added later as an afterthought.
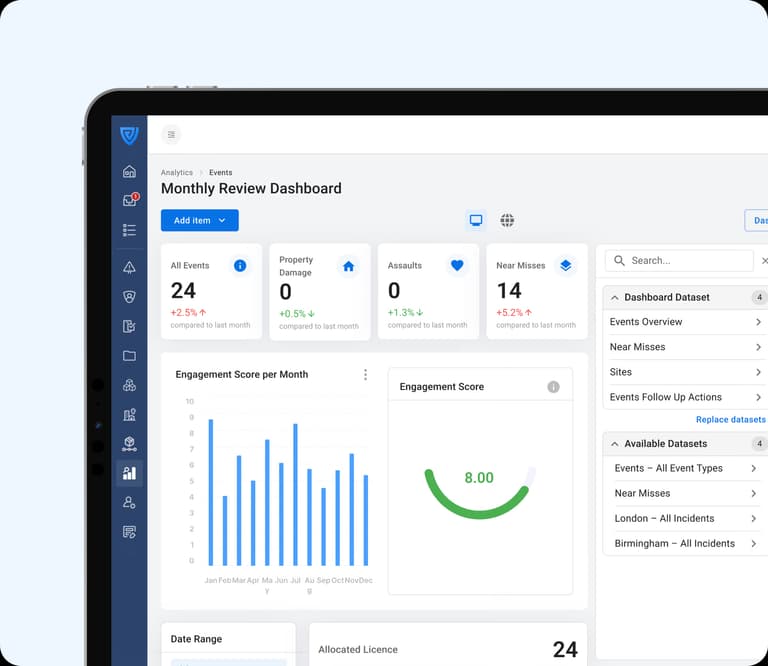
This information feeds directly into a unified dashboard, where key safety metrics are automatically calculated and visualised. The dashboard provides a clear, real-time overview of your organisation’s health and safety performance.
You can view aggregated totals or break down hours worked by employees versus contractors, with flexible filters that allow you to drill into any specific date range you need.
And if you’re looking to capture other safety data, our new analytics dashboard builder enables you to visualise all the insights you need in a few simple clicks. Drag and drop the charts and data you want to see to get a snapshot of safety performance instantly. Or simply describe what you want to create, and you’ll get AI-optimised suggestions for the best way to present a certain dataset, giving you complete customisation of your dashboard.
Get a demo today to see how Vatix’s Health and Safety platform and analytics dashboards can help you to measure and improve safety performance.
